vnstatはコマンドベースのネットワークtrafficモニターです。
trafficというとcactiとかmrtgといったのが最初に思い浮かぶと思いますが、それだとわざわざWebサーバを立てなくてはいけません。
もっと手軽に導入できるのがvnstatです。
また、時間別や日別など、様々なパターンでモニタリングができます。
1.インストール
ということでまず、インストール。
今回利用するサーバはAmazon Linuxです。
$ sudo yum install --enablerepo=epel vnstat
redhat系のインストールはepelリポジトリからyumインストールで可能ですが、ubuntu系はaptで以下の方法でインストールできます。
$ sudo apt-get install vnstat vnstati
また、vnstatに関する設定は/etc/vnstat.confに記載され、データの保存場所やdata保存間隔などが設定できます。
2.コマンド実行
それではコマンドを実行してみましょう。
$ vnstat
No database found, nothing to do. Use --help for help.

A new database can be created with the following command:
vnstat -u -i eth0

Replace 'eth0' with the interface that should be monitored.

The following interfaces are currently available:
eth0 lo
“No database found …”と表示されました。
インストールしたてで「まだデータベースが何もないよ!」と言っているみたいです。
続きを読むと”vnstat -u -i eth0”でデータベースが作成できると書いてあります。
ということで、作成してみます。
2.1. DB作成
$ vnstat -u -i eth0
Error: Unable to read database "/var/lib/vnstat/eth0".
Info: -> A new database has been created.
一行目には”Error”とありますが、二行目には”Info”でデータベースが作成されたと記載があります。
これでデータベースが新規に作成されました。
$ ls /var/lib/vnstat/
eth0
ということで再度コマンドを実行します。
$ vnstat
eth0: Not enough data available yet.
まだ有効なデータがないと言われてしまいました。
2.2 データの更新
ということで、データを更新します。
$ vnstat -u -i eth0
2.3 データの確認
では改めて確認してみましょう。
$ vnstat
Database updated: Tue Jul 7 15:16:40 2015

eth0 since 07/07/15

rx: 25 KiB tx: 13 KiB total: 38 KiB

monthly
rx | tx | total | avg. rate
------------------------+-------------+-------------+---------------
Jul '15 25 KiB | 13 KiB | 38 KiB | 0.00 kbit/s
------------------------+-------------+-------------+---------------
estimated -- | -- | -- |

daily
rx | tx | total | avg. rate
------------------------+-------------+-------------+---------------
today 25 KiB | 13 KiB | 38 KiB | 0.01 kbit/s
------------------------+-------------+-------------+---------------
estimated -- | -- | -- |
デフォルトだとmonthlyとdailyの2種類が表示されますが、オプションによってweekly表示にすることも可能です。
$ vnstat -w

eth0 / weekly

rx | tx | total | avg. rate
---------------------------+-------------+-------------+---------------
last 7 days 25 KiB | 13 KiB | 38 KiB | 0.00 kbit/s
current week 25 KiB | 13 KiB | 38 KiB | 0.00 kbit/s
---------------------------+-------------+-------------+---------------
estimated -- | -- | -- |
2.4. オプションの確認
どのような出力方法が可能かは、”--help”オプションで確認ができます。
$ vnstat --help
vnStat 1.11 by Teemu Toivola <tst at iki dot fi>

-q, --query query database
-h, --hours show hours
-d, --days show days
-m, --months show months
-w, --weeks show weeks
-t, --top10 show top10
-s, --short use short output
-u, --update update database
-i, --iface select interface (default: eth0)
-?, --help short help
-v, --version show version
-tr, --traffic calculate traffic
-ru, --rateunit swap configured rate unit
-l, --live show transfer rate in real time

See also "--longhelp" for complete options list and "man vnstat".
2.5. 自動取得設定(daemonの起動)
また、このvnstatはdaemonが用意されているので、起動するだけで自動で情報が取得できます。
$ sudo service vnstat start
vnstatd を起動中: [ OK ]
3.グラフの作成
また、vnstatiで取得したデータからpngのグラフも作成できます。
rx:受信
tx:送信
[月別(-m)]
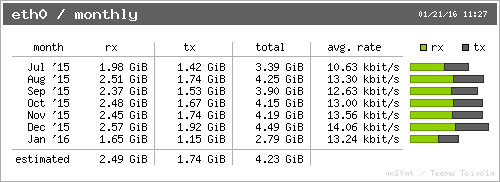
$ vnstati -m -o ./monthly.png
[日別(-d)]

$ vnstati -d -o ./daily.png
[時間別(-h)]
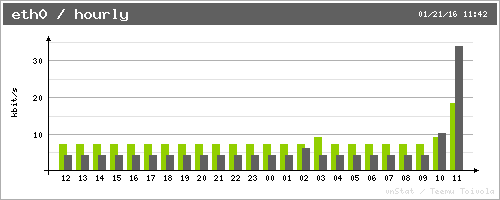
$ vnstati -h -o ./houly.png
[時間別サマリ(-vs)]
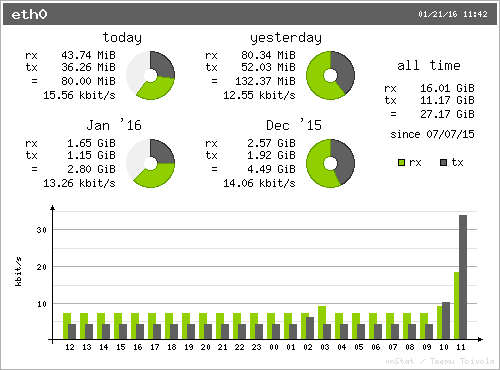
$ vnstati -vs -o ./hsum.png
以上のように、気軽に導入できグラフ化も可能なのがとても便利です。