
Ask sysadmins about their worst fears, and you’ll see that “running out of server resources” is among the top 5 mentions.
As applications and users create processes to carry out tasks, they occupy a portion of server resources (mainly CPU and RAM). As the number of processes increases, the available resources for new processes start to go down.
In extreme cases, the system slows down, and the performance suffers.
So, you need a way to monitor resource consumption by processes so that you can review resource consumption and take corrective actions.
The top (short for table of processes) command offers a real-time display of running processes in Linux, presenting critical information about resource utilization, such as CPU and memory usage.
This tutorial will discuss how you can use the Linux top command. We’ll start with an overview of the command and then discuss several application scenarios where you can apply the command to extract specific information about resource consumption.
Table Of Contents
- The Syntax of the top Command
- Examples of Using the top Command in Linux
- Basic Requirements
- Use Case #1: Display All Processes
- Use Case #2: Send a Signal
- Use Case #3: Exit After X Cycles
- Use Case #4: Sort Processes
- Use Case #5: Display Processes Belonging to a Specific User
- Use Case #6: Change the Memory Measurement Units
- Use Case #7: Modify the Displayed Information
- Use Case #8: Modify Display Color
- Use Case #9: Display Command Line Processes
- Use Case #10: View Process Tree Structure
- Use Case #11: Show Active Tasks
- Use Case #12: Limit Data Display
- Use Case #13: Change Process Priority
- Use Case #14: Sort and Display Specific Processes
- Conclusion
- FAQs
The Syntax of the top Command
Launch the terminal and type top to start the command in the interactive mode.
You can see detailed information about active processes and related system details. You can further customize this view by combining several Linux top command options.
Here is the standard syntax for the command:
# top -hv | -bcEeHiOSs1 -d secs -n max -u | U user -p pid(s) -o field -w [cols]
Using the syntax’s switch character (-) and whitespace is optional.
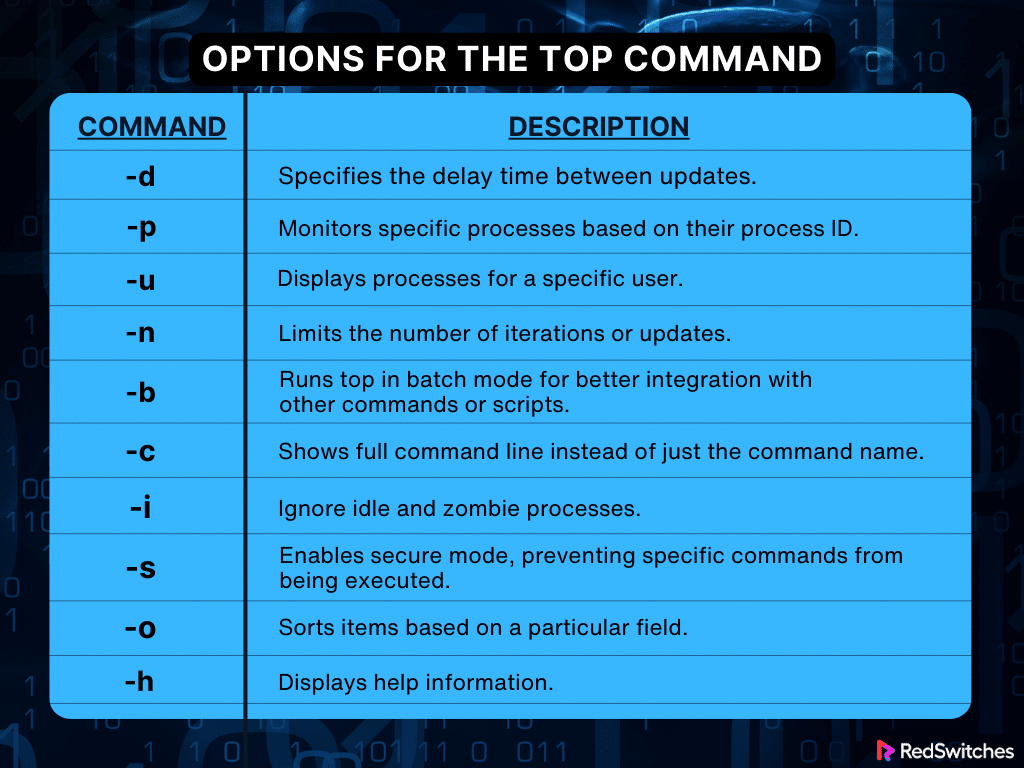
Options for the top Command
Here’s a summary of the most common top command options.
Also Read: 6 Simple Examples of Using the Linux watch Command
Examples of Using the top Command in Linux
Now that you know the basic syntax and popular options to modify the output of the top command, let’s discuss how to use the command to monitor processes and display specific information.
It’s important to note that the options are case-sensitive; this means that using uppercase N and lowercase n will trigger different actions and output.
Basic Requirements
Before experimenting with examples, you should have the following:
- A system running a mainstream Linux distribution
- An account with administrator/root privileges
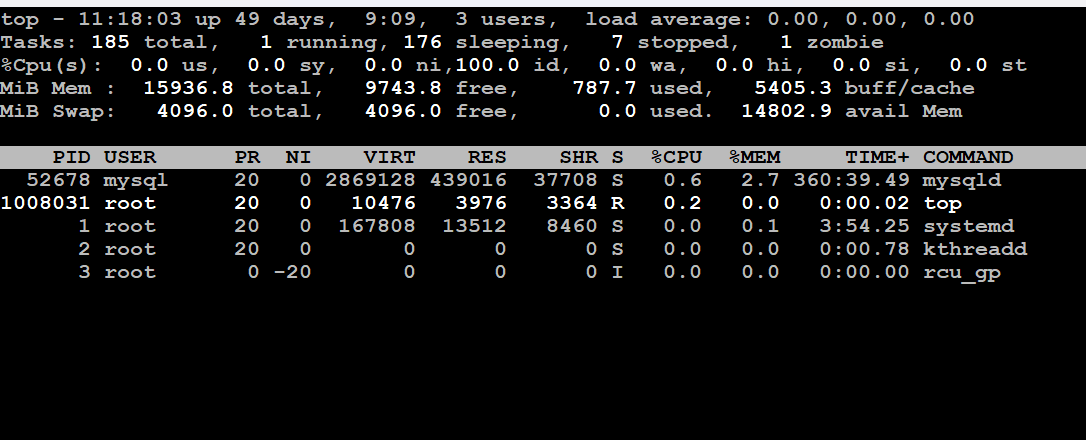
Use Case #1: Display All Processes
Open the terminal and type the following command to view all active Linux processes on your system:
# top
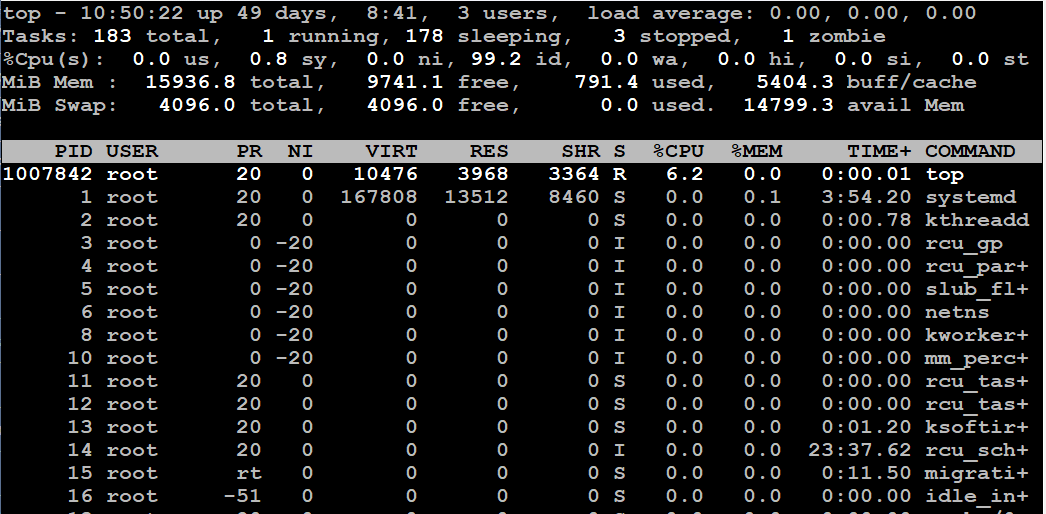
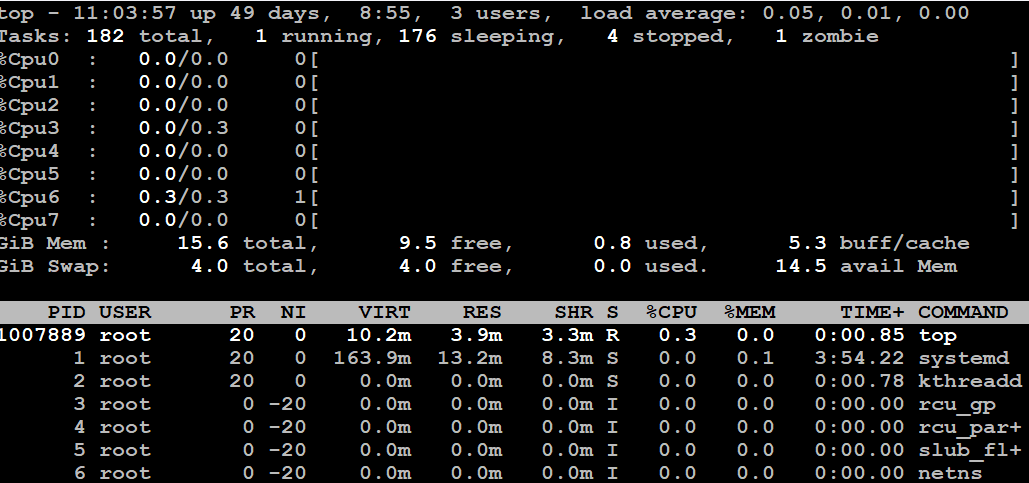
The output of the command is divided into two areas: the summary area, which acts as a dashboard displaying statistics on resource usage, and the task area, where a list of all processes is shown.
By default, the system refreshes this information every three seconds.
When dealing with an extensive list of processes, you can easily navigate it using the Up and Down arrow keys and Page Up and Page Down keys.
Exiting the output is straightforward—just press the q key. This simplicity in navigation and termination makes the top command a user-friendly tool for monitoring and managing processes on your Linux system.
Also Read: 13 Examples That Showcase the xargs Command in Linux
Use Case #2: Send a Signal
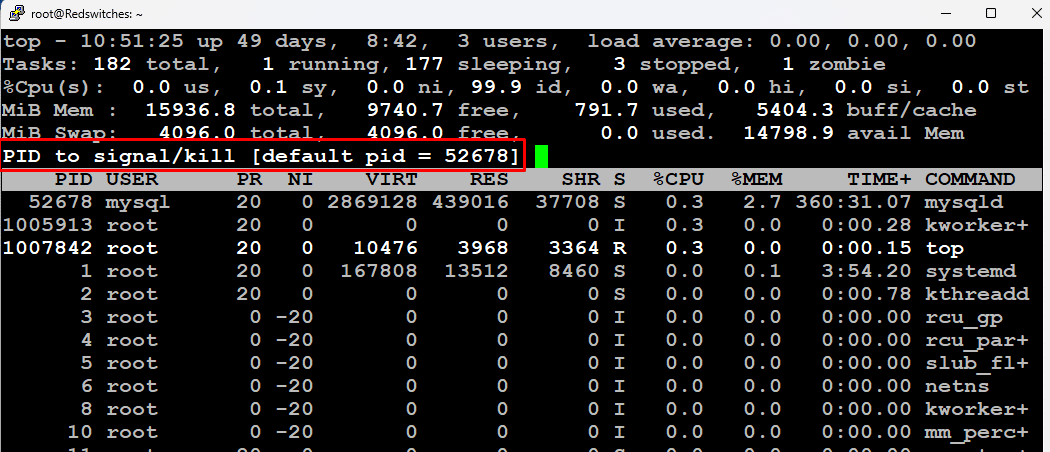
You can use the top command to send a signal to an active process by pressing k and entering the PID (Process ID) of the desired process.
If you don’t specify a particular signal, the default action is to terminate the process. This functionality provides a straightforward way to interact with and manage processes directly from the command’s interface.
Use Case #3: Exit After X Cycles
The top command continuously updates statistics until you exit the program by pressing q.
You can modify this default behavior with the following command:
# top -n [X]
Here, [X] indicates how often (number of times) you want the top command to update the display.
Use Case #4: Sort Processes
The top command organizes processes by the %CPU column by default. If you want to sort the processes by a different metric, you can use these keys:
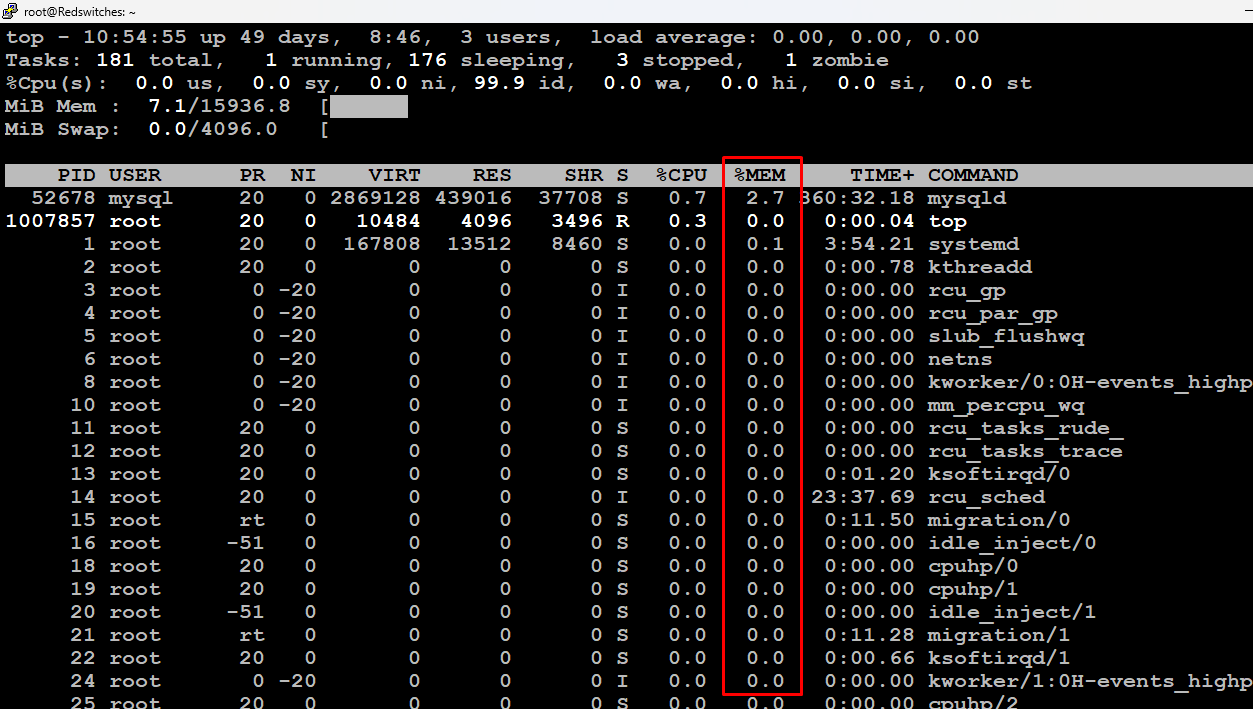
- Press M to sort by the %MEM column.
- Press N to sort by the PID column.
- Press T to sort by the TIME+ column.
- Press P to revert to sorting by the %CPU column.
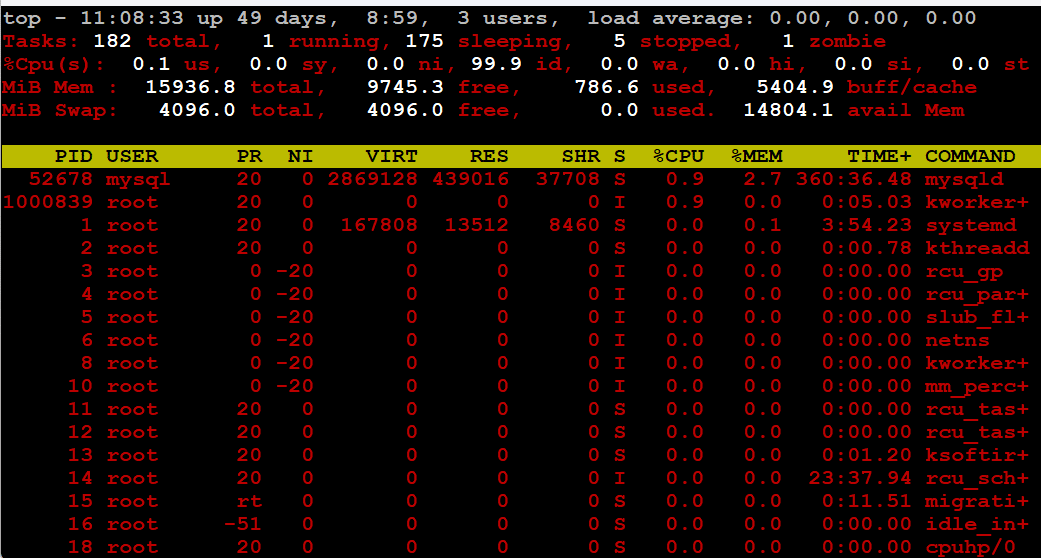
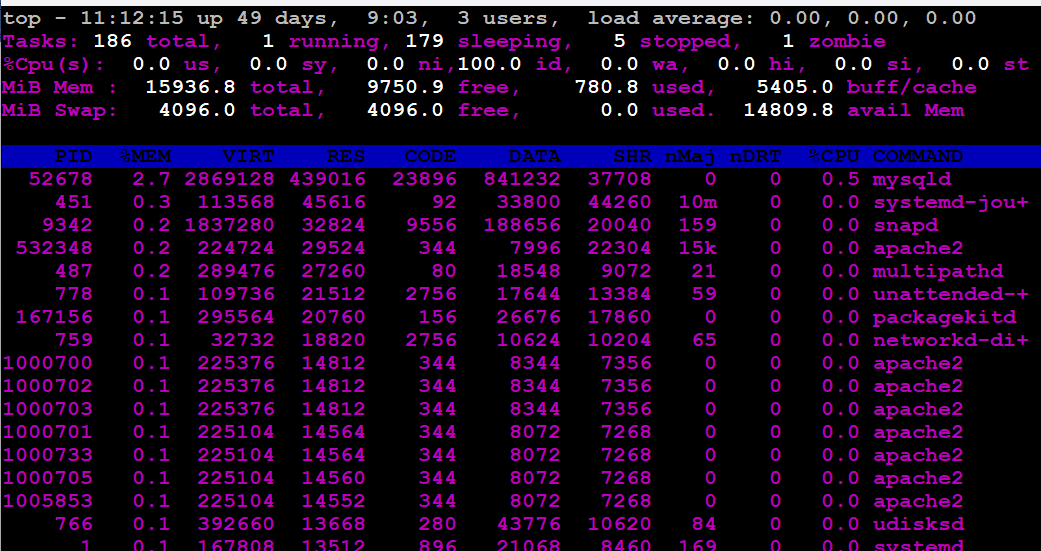
In this example, the list of processes is organized based on the percentage of memory usage, sorted by the %MEM column:
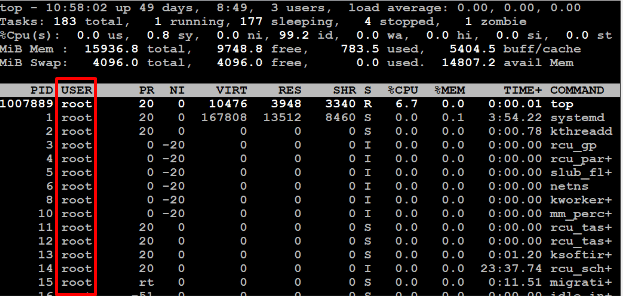
Use Case #5: Display Processes Belonging to a Specific User
The -u option allows you to see processes for a user. You can activate this by pressing the u key when the top is running or by using the following syntax:
# top -u [user name]
While in interactive mode, pressing the u key in the top command will prompt you to enter either a user name or user ID. You can filter and display only the processes associated with the specified user, providing a focused view of system activity and resource consumption by a specific user.
For instance, the output in the following screenshot is limited to displaying processes for the root user.
Also Read: lsof Command in Linux with Examples
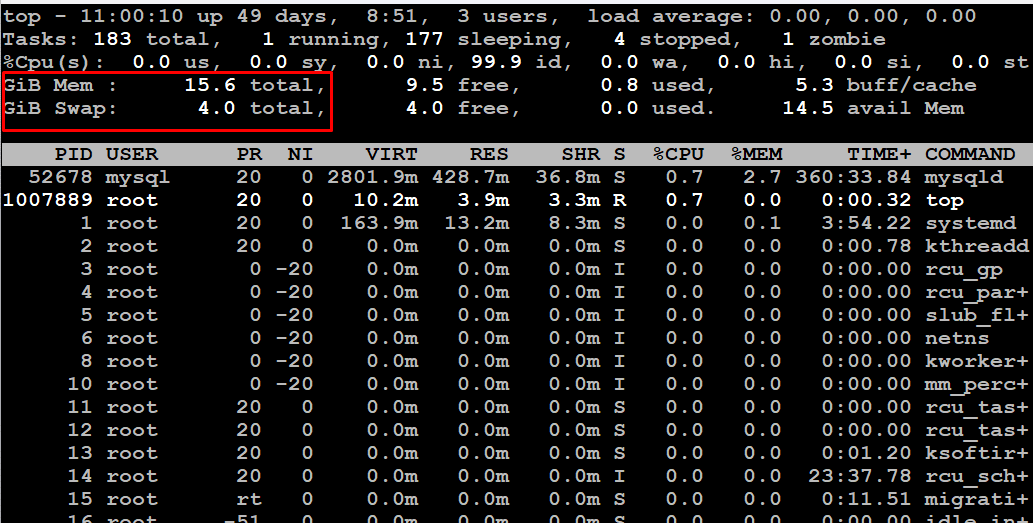
Use Case #6: Change the Memory Measurement Units
To select the measurement unit for memory values in the top command, press E for dashboard memory units and lowercase e for process list memory units. The available options are:
- Kibibytes (KiB)
- Mebibytes (MiB)
- Gibibytes (GiB)
- Tebibytes (TiB)
- Pebibytes (PiB)
- Exbibytes (EiB) [this is only applicable to memory values.]
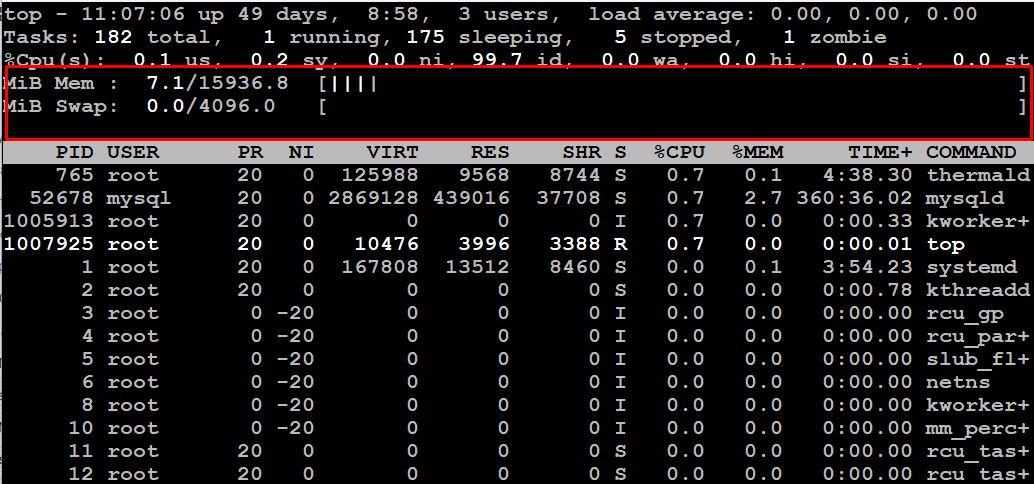
The currently selected unit is indicated as the first item on the fourth and fifth lines.
For instance, in the following screenshot, the dashboard memory units are set to Gibibytes (GiB), while the memory units for the process list are set to Mebibytes (MiB):
Use Case #7: Modify the Displayed Information
The standard output of the top command includes extensive details, which can sometimes be overwhelming, and you may miss critical information in the clutter.
However, you can easily customize what’s displayed using specific key commands to focus on the necessary information or remove specific parts from the summary.
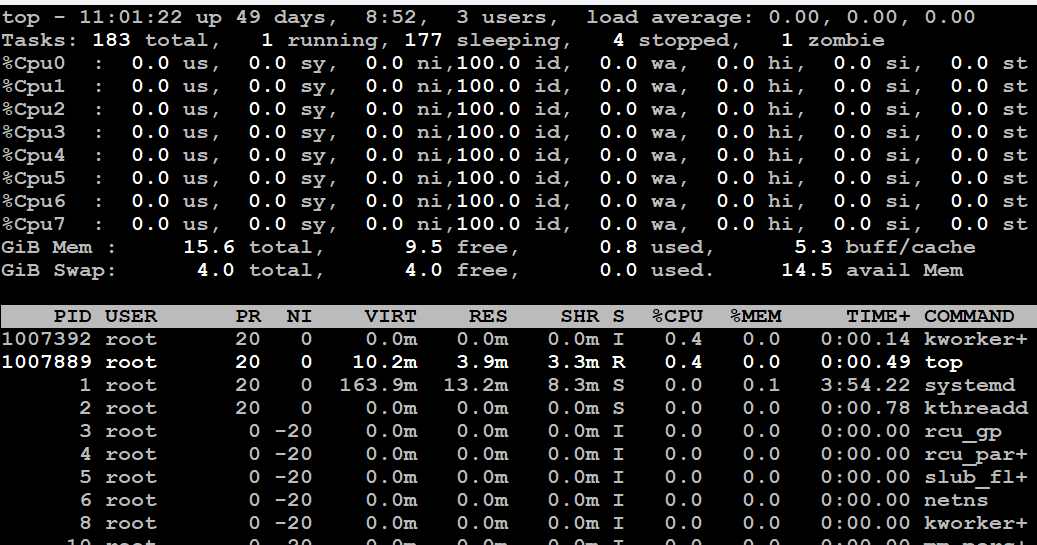
Statistics for Individual CPU Core
To view the statistics of each CPU core, simply press the 1 key on the keyboard. You can press the key again to toggle the display of these core statistics on and off.
Visual Representation of CPU Usage
The top command offers basic ASCII graphs representing the usage of individual CPU cores. You can switch these graphs on or off by pressing the t key.
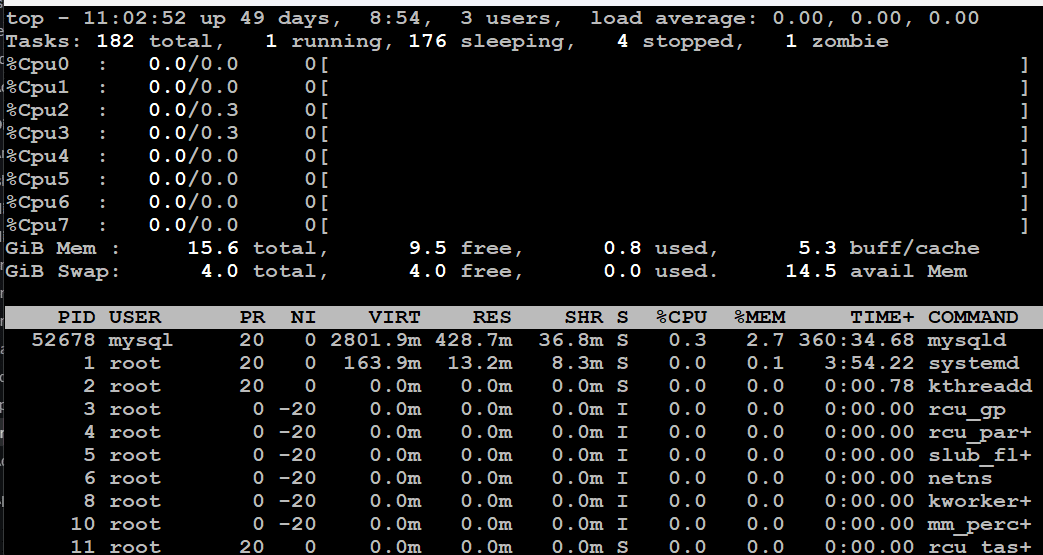
Press the t once more to switch the graph display to solid block characters.
Graph For Memory Utilization
The command additionally offers graphical display features for memory and swap memory usage. You can toggle a visual representation of memory usage on and off by pressing m.
Use Case #8: Modify Display Color
You can enhance the visibility and readability of the information in the output by changing the colors. Press the z key to introduce color to the display.
Initially, the default color is set to red. For additional customization and selecting a different color, please proceed with the following steps:
- Access the color settings page by pressing the Z key.
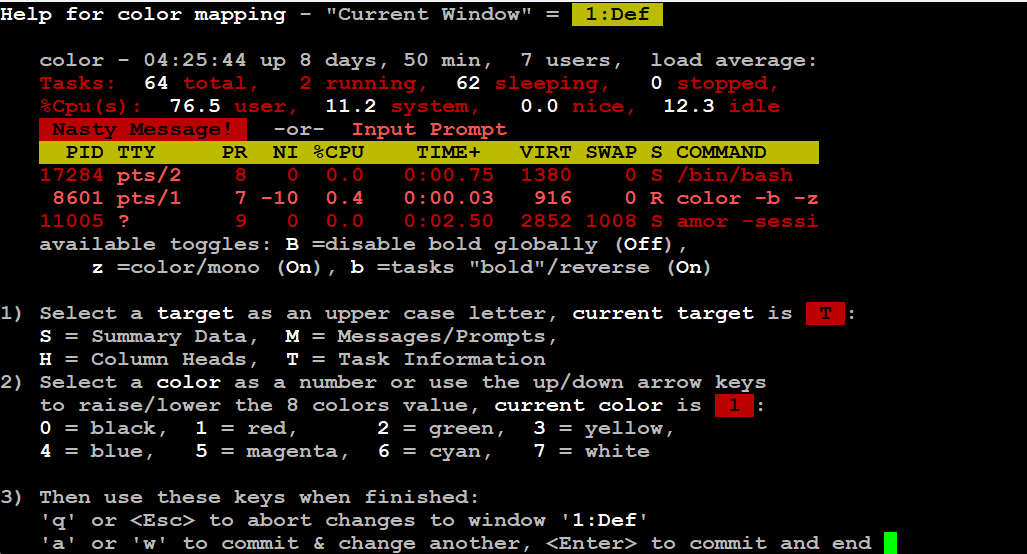
- Select which display field you want to modify by pressing:
- S: Area for summary data.
- M: Section for messages and prompts.
- H: Heading columns.
- T: Information about tasks in the process list.
Press Enter to confirm your choice.
- Pick the color for the selected element with one of the following keys:
0: Black.
1: Red.
2: Green.
3: Yellow.
4: Blue.
5: Magenta.
6: Cyan.
7: White.
Press Enter to confirm your selection.
Then, proceed to test the updated settings as demonstrated below:
Use Case #9: Display Command Line Processes
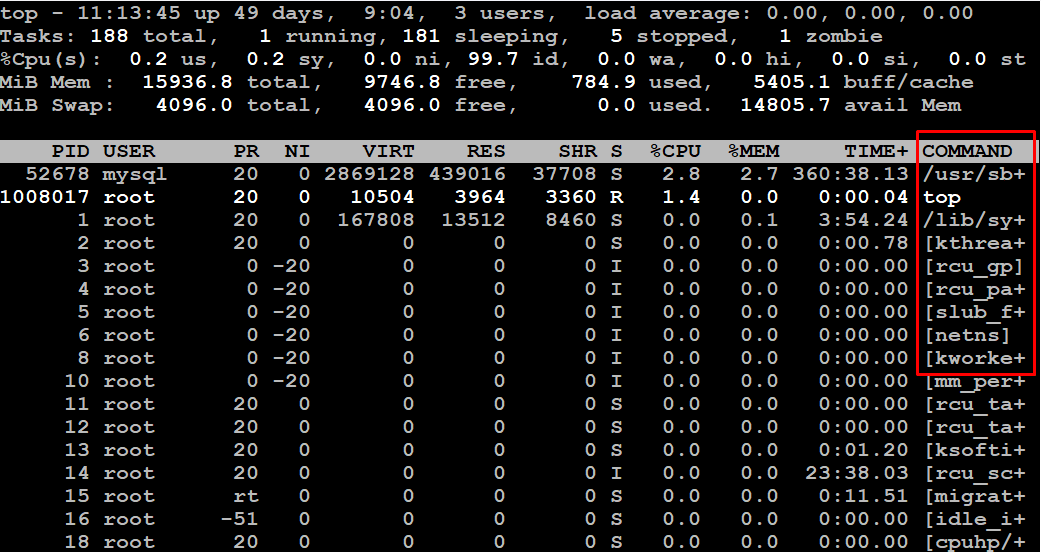
To view the entire command line rather than just the process name, press the c key. Press it once more to revert to showing only the process name.
Use Case #10: View Process Tree Structure
Press the V key to view all processes initiated or created by other processes.
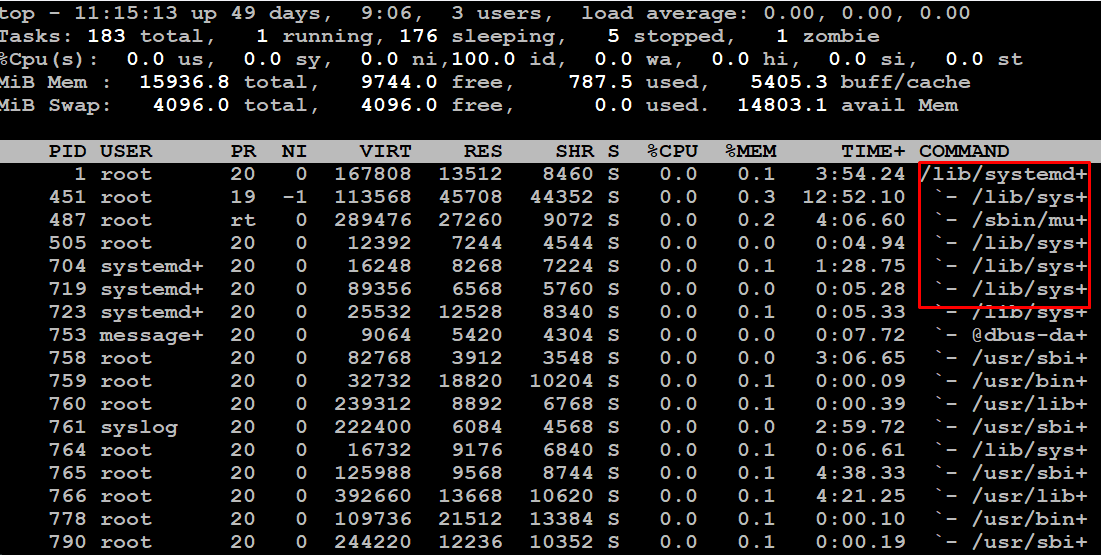
The tree view is beneficial for visualizing your system’s parent-child hierarchy of processes.
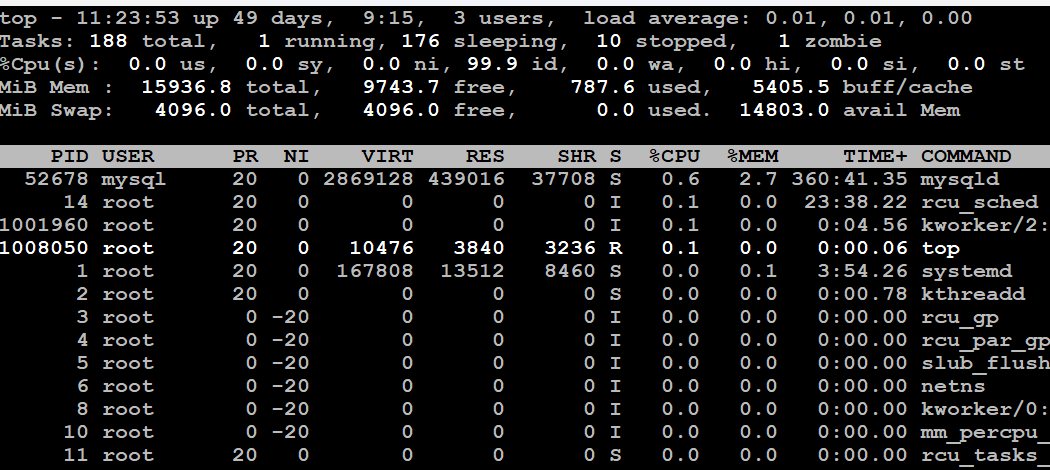
Use Case #11: Show Active Tasks
Press the I key to display only active tasks in the output.
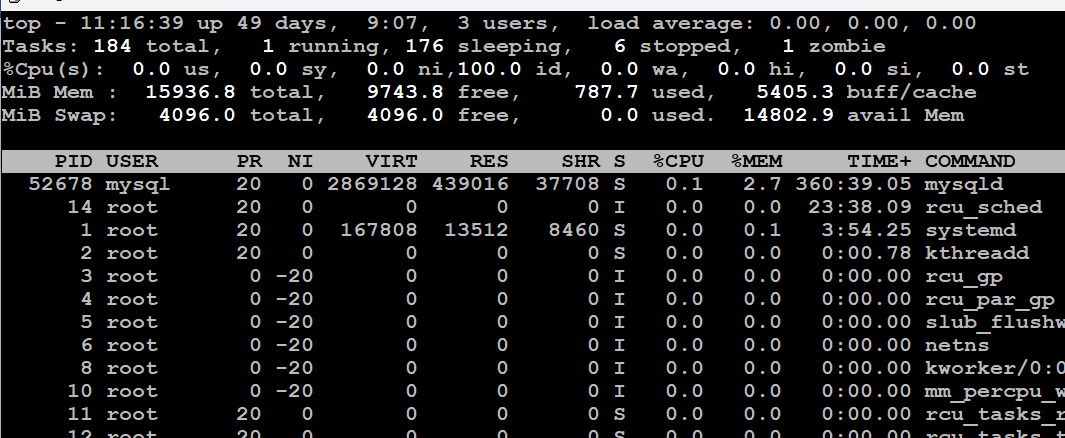
The output hides the tasks that have not utilized CPU resources since the previous update. This is a simple way of reducing the clutter on the screen.
Use Case #12: Limit Data Display
Press the n key to restrict the number of processes displayed in the output.
This action allows you to specify the exact number of processes you wish to view, irrespective of the total number of active processes. For instance, if you need to see only the top 5 processes, you can enter the number after pressing n.
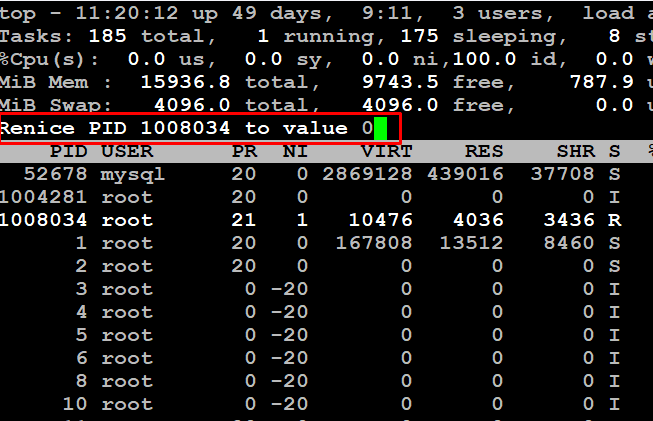
Use Case #13: Change Process Priority
The top command enables the adjustment of process priority (or nice value). The “nice value” is a single numerical value that influences the scheduling priority of a Linux process. The lower the nice value, the higher the priority, and vice versa.
Here’s how to do it:
- Initiate the top command and then press the r key.
- Enter the Process ID (PID) when prompted, and hit Enter.
- Next, you’ll be asked for a new nice value. Input the desired value and press Enter.
Use Case #14: Sort and Display Specific Processes
The filter function in the top command lets you apply a filter expression to narrow down the processes displayed in the list.
You can set up the filter feature by pressing the o key. The utility will then prompt you to input a filter expression.
For instance, consider the following filter:
# %MEM>5.0
When applied, the top command displays only those processes that consume more than 5% of memory. You can remove these filters by pressing the = key.
Conclusion
The top command in Linux is a robust and interactive tool for monitoring system performance. This command provides a comprehensive process list, offering insights into memory units utilized by each process, as well as valuable information on the system’s CPU time, load average, and physical and swap memory usage.
Notably, the layout of the command, particularly the first and second lines, offers a quick overview of key metrics, including system uptime, average load, running tasks, and the current time.
The top command is great for sorting processes, monitoring idle time, and offering detailed insights into running tasks. It’s a must-have tool for optimizing resource usage on Linux systems. Understanding how to use the top command is vital to keeping your system efficient and stable.
RedSwitches offers the best dedicated server pricing and delivers instant dedicated servers, usually on the same day the order gets approved. Whether you need a dedicated servers, a traffic-friendly 10Gbps dedicated server, or a powerful bare metal server, we are your trusted hosting partner.
FAQs
Q. What is the top command in Linux?
The top command in Linux is a popular interactive tool that gives a real-time view of tasks and processes on the system. It helps users monitor CPU and memory usage, running processes, and various system activities.
Q. How do you read the top command output in Linux?
The output of the top command in Linux consists of several sections, such as the header, tasks area commands, and task area. In the header, you find details like the top version, total number of tasks, CPU and memory usage. The tasks area commands present running processes with information like PID, user, CPU and memory usage, and more.
Q. What are some examples of using the top command in Linux?
Some examples of using the top command in Linux include monitoring system processes, sorting the process list based on different criteria, showing the full command line used for running processes, and viewing the processes running with a particular user ID or user name.
Q. How can the top command view system processes in a Linux server?
The top command in Linux provides a detailed view of the system processes, including the CPU and memory usage, process IDs, user details, running time, etc. This information helps in analyzing and managing the system processes efficiently.
Q. What does the top version indicate in the top command output?
The version of the top command displayed in the output provides information about the specific version of the top command being used, which can help understand the features and capabilities available in that version.
Q. How do you identify the full command line used for running processes with the top command?
The full command line used for running processes can be seen in the output, enabling users to understand the tasks and processes being executed thoroughly.
Q. What can the top command output in Linux help determine?
The top command output in Linux provides crucial information such as CPU and memory utilization, running processes, system resource usage, and other detailed statistics, which aid in monitoring and managing the system effectively.
Q. How can the task area commands in the top command output be used?
The task area commands in the top command output allow users to interactively manage and manipulate the displayed processes, such as sorting the process list based on CPU usage, memory usage, or other criteria and understanding the system’s resource utilization.
Q. Is it possible to view the processes running with a specific user ID or user name using the top command?
Yes, the top command in Linux enables users to filter and view the processes running with a specific user ID or user name, facilitating a focused analysis of the tasks and activities associated with that user.
Q. How can the top command output be used to monitor the CPU utilization of processes?The top command output provides real-time statistics for each CPU, including the usage percentage, running processes, memory usage, and other details, helping users monitor and analyze the CPU utilization of processes on the system.